Classifying a Small Cleanroom using the MET ONE HHPC 6+
Introduction
This applications note will demonstrate the classification of a small ISO Class 5 Clean room and associated ISO Class 7 gowning room using a MET ONE model HHPC 6+ handheld particle counter. Reference will be made to the ISO 14644-1 clean room classification standard with regards to sample size, locations selected, limits and calculations necessary to determine the compliance status of the clean zone to ISO 14644-1 Class 5.
Background
A precision engineering manufacturer has established a small ISO Class 5 clean room facility to provide a controlled environment for final assembly of custom optical assemblies. The main ISO Class 5 assembly clean room is accessed via a ISO Class 7 gowning area. In accordance with their ISO 9000 quality policies the QA group intended to have the assembly and gowning areas certified every six months in the “at rest” condition. In addition, QA wished to conduct particle studies during optical assembly operations as part of a continuous quality improvement initiative, measuring air particle counts at the sampling location utilizing a portable air particle counter.
The QA manager chose to avoid the costs associated with outsourcing the re-certification to a third party every six months with the intention of performing the routine certification in-house. Given the small size of the clean room to be certified it was decided to use a handheld particle counter. The MET ONE model HHPC 6+ was chosen for its simple USB data transfer to PC without the need for software. Also the MET ONE HHPC 6+ instrument features an on-screen graphical trending function which was considered to be useful in assisting particle profiling studies.
The Cleanroom
QA’s first task was to examine the clean room and establish sample locations as well as sample volumes necessary to comply with the requirements of ISO 14644 “Clean rooms and associated controlled environments” Part 1 and 2. The dimensions of the clean room were verified and a floor plan drawn up.
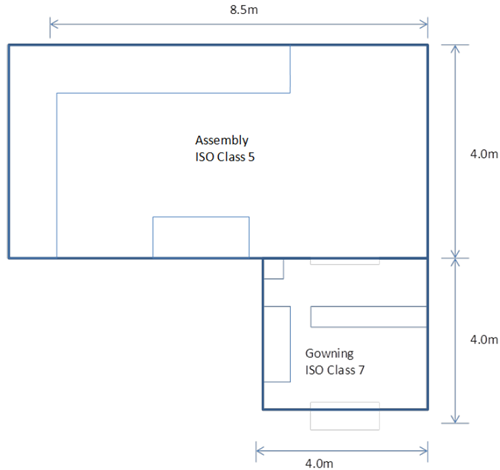
Figure 1. The cleanroom layout
Classification Frequency
ISO 14644 specifies a maximum time interval between reclassification as 6 months for classifications less than or equal to ISO Class 5 and 12 months for clean rooms greater than ISO Class 5. Classification may be conducted either “at rest” or “in operation”. The QA Manager chose to certify “at rest” every six months in accordance with the ISO 14644-1 and -2 standard.
Choosing Particle Sizes
ISO 14644-1 allows clean rooms to be classified within a range of particle sizes depending upon the target cleanliness class. ISO Class 5 clean rooms may be classified at any size between 0.1um and 5.0um whereas ISO Class 7 clean rooms may be classified at sizes 0.5um to 5.0um. The QA manager had established that their optical assemblies were sensitive to particles down to 0.5um and therefore chose 0.5um as the classification size for both the Assembly and Gowning zones.
Establishing Sample Locations
ISO 14644-1 defines the minimum number of locations to be sampled for particles based on the size of the area to be classified. The formula is as follows:
NL = √𝐴
Where
NL Number of locations
A The area of the clean room in square meters
The calculation result that is not an integer is to be rounded up to the next whole number.
| Area | ISO Class | L (m) | W (m) | Area (m2) | √Area m2 | # Locations |
| Assembly | 5 | 8.5 | 4 | 34 | 5.83 | 6 |
| Gowning | 7 | 4 | 4 | 16 | 4.00 | 4 |
Figure 2. Calculating the number of sample locations
In accordance with generally accepted practice, it was decided to distribute the required number of sampling locations evenly within the clean zones to be monitored.
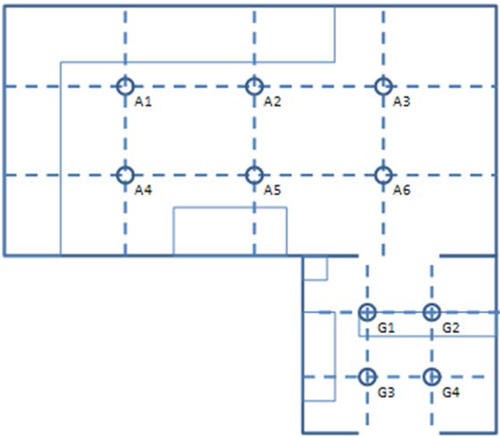
Figure 3. Distributing sample locations within the clean zones
Establishing Sample Air Volume
ISO 14644-1 defines the minimum sample volume as that volume whereby a minimum number of 20 particles would be detected if the particle concentration for the largest particle size were at the class limit for the designated ISO Class. The formula is as follows –
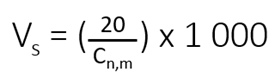
Where
Vs The minimum single sample volume per location in liters
Cn,m The class limit (number of particles per cubic meter) for the largest considered particle size (n) specified for the class limit(m).
QA chose to classify at a single size, 0.5um.
| ISO Classification Number (N) | Maximum concentration limits (particles/m3 of air for particles equal to and larger than the considered sizes shown below (concentration limits are calculated in accordance with equation (1) in 3.2) | |||||
| 0.1 µm | 0.2 µm | 0.3 µm | 0.5 µm | 1.0 µm | 5.0 µm | |
| ISO Class 1 | 10 | 2 | ||||
| ISO Class 2 | 100 | 24 | 10 | 4 | ||
| ISO Class 3 | 1 000 | 237 | 102 | 35 | 8 | |
| ISO Class 4 | 10 000 | 2 370 | 1 020 | 352 | 83 | |
| ISO Class 5 | 100 000 | 23 700 | 1 020 | 3 520 | 832 | 29 |
| ISO Class 6 | 1 000 000 | 237 000 | 102 000 | 35 200 | 8 320 | 293 |
| ISO Class 7 | 352 000 | 83 200 | 2 930 | |||
| ISO Class 8 | 3 520 000 | 832 000 | 29 300 | |||
| ISO Class 9 | 35 200 000 | 8 320 000 | 293 000 | |||
| NOTE: Uncertainties related to the measurement process require that concentration data with no more than three significant figures be used in determining the classification level | ||||||
Figure 4. Selected Airborne Particulate Cleanliness Classes for Cleanrooms and Clean Zones (reproduced from Table 1, ISO 14644-1)
Calculating Required Sample Size
Referring to Figure 4
Assembly area (ISO Class 5) C0.5,5 = 3520
Gowning area (ISO Class 7) C0.5,7 = 352000
Assembly area minimum sample volume per location
Vs = 20/3520 x 1000
Vs = 5.68 Liters
Gowning area minimum sample volume per location
Vs = 20/3520000 x 1000
Vs = 0.0568 Liters
Note that ISO 14644-1 places lower limits on minimum volumes sampled at each location as being at least 2 Liters and that sampling must be conducted for at least 1 minute. The MET ONE HHPC 6+ Handheld particle counter has a sampling flow rate of 2.83 Liters per minute. Therefore, the calculated requirement for the Assembly area is –
Vs = 5.68 Liters at 2.83 Liters per minute requires a nominal sample time of 2.0 minutes per location.
The calculated requirement for the Gowning area is therefore –
Vs = 0.0568 Liters at 2.83 Liters per minute requires a sample time of 0.02 minutes per location. Note that in the case of the Gowning area, 1 minute minimum sample period specified by ISO 14644-1 applies. Although only one sample is technically required at each of the 4 locations in the gowning area it was decided to take 2 samples at each location as with the assembly area for the simplicity of consistency.
Sampling Plan Summary
Assembly area (ISO Class 5) 2 x 1 minute samples at each of 6 locations
Gowning area (ISO Class 7) 2 x 1 minute samples at each of 4 locations
Frequency: Conducted every six months
Setting up the MET ONE HHPC 6+
Setting up the MET ONE HHPC 6+ for the classification exercise is straightforward. First, channel size 0.5um is selected with data reported as cumulative counts normalized to cubic meter. The sample method is set to 2 x 1 minutes and particle counts are taken for each of the six locations in the assembly area. For the gowning area 2 x 1 minute particle counts are taken at the 4 locations.
Analysis of Results
Annex C of ISO 14644-1 provides the statistical calculations for analyzing the particle count data. This takes the form of a Students-t test whereby the 95% UCL (upper confidence limit) is calculated and compared to the class limit. The formulas are well documented in Annex F and can be easily deployed in a spreadsheet.
|
Assembly Area |
Number of Locations - 6 | ||||||
| Counts/m3 | A1 | A2 | A3 | A4 | A5 | A6 |
Grand Mean of |
| Sample 1 | 1 412 | 1 059 | 2824 | 2 824 | 706 | 2 471 | |
| Sample 2 | 3 177 | 706 | 0 | 353 | 706 | 3 177 | |
| Location Average | 2 295 | 883 | 1 412 | 1 589 | 706 | 2 824 | 1 618 |
| Square of Errors | 457 765 | 540 838 | 42 402 | 865 | 831 592 | 1 454 637 | |
| Square root of (sum of squared errors / Number of locations -1 ) | S | 816 | |||||
| Assembly Area | 95% UCI | 1 890 | |||||
| Limit | 3 520 | ||||||
| Gowning Area | Number of Locations - 4 | ||||
| Counts/m3 | A1 | A2 | A3 | A4 | Grand Mean of Location Averages |
| Sample 1 | 26 475 | 14 120 | 11 649 | 31 770 | |
| Sample 2 | 3 883 | 28 946 | 26 122 | 33 888 | |
| Location Average | 15 179 | 21 533 | 18 886 | 32 829 | 22 107 |
| Square of Errors | 47 991 988 | 329 046 | 10 375 646 | 114 969 326 | |
| Square root of (sum of squared errors / Number of locations -1 ) | S | 7 608 | |||
| Gowning Area | 95% UCI | 26 672 | |||
| Limit | 352 000 | ||||
Both the Assembly room and the Gowning area results produce 95% Upper Confidence Intervals less than the ISO Class limits and therefore these areas were certified as being, at rest, ISO Class 5 and ISO Class 7 respectively.
