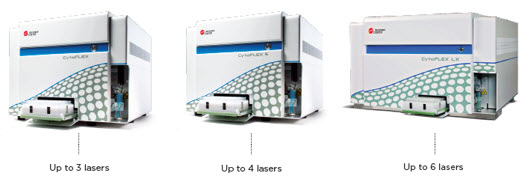
The CytoFLEX Platform
The CytoFLEX Platform is a compact system with innovative technology borrowed from the telecommunications industry that optimizes excitation and emission, minimizing light loss and maximizing sensitivity. The same CytExpert software is used for acquisition and analysis across the entire platform. With 88% of surveyed organizations agreeing that the CytoFLEX was easy for lab personnel to learn and master.
- Exquisite sensitivity
- Small particle analysis in a benchtop analyzer
- Extensive set of repositionable band pass filters
- Flexibility to upgrade by adding additional parameters
- Intuitive software to facilitate multicolor analysis
- When installed in Electronic Management mode, 21 CFR Part 11 compliance tools are enabled.
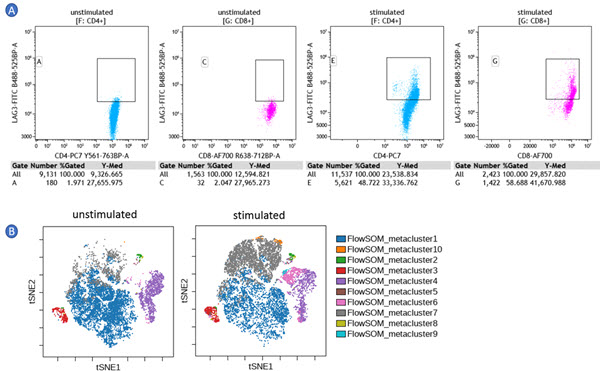
Analysis of Stimulated and Unstimulated PBMCs T cells. PBMCs were isolated from blood from a healthy donor and cultured for 4 days either with (stimulated) or without (unstimulated) anti-CD3 and anti-CD28 coated beads prior to cryopreservation. Cultured cells were then stained using a dry, unitized deep-well plate-based assay prepared in our LUCID Panel Design and Cocktailing Custom Service consisting of backbone markers CD45-KrO, CD3- APC-A750, CD4-PC7, and CD8-A700. Additional markers for activation state were added as liquid add-ins, including CD25-PE, LAG-3-FITC, TIM-3-APC and PD-1-PC5.5 as well as ViaKrome 808 Fixable Viability Dye. Data was acquired using CytExpert software and analyzed using Kaluza Analysis Software. LAG-3 expression measured from unstimulated (blue dot plot) or stimulated (pink dot plot) CD4+ and CD8+ populations as indicated are displayed (panel A). Panel B shows the same wells analyzed with FlowSOM using the Cytobank Platform (panel B).
The Standards
CytExpert Software Features for Plate-Based Acquisition and Analysis
Setup
- Upload a CSV file with metadata for each well
- Ten fields available for sample identification
- Sample groups are recognized and color coded
Acquisition
- Use the plate protocol to create groups of wells
- Control acquisition settings for each group
- Set the Mix/backflush and stopping rules for each well
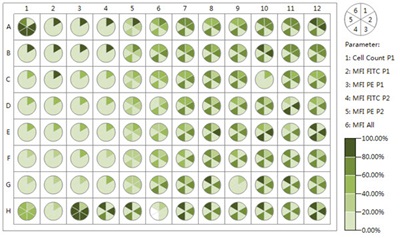
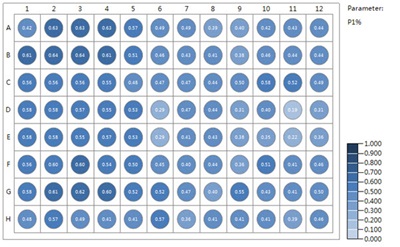
Analysis
- Values can be displayed on single parameter heatmaps
- Heatmaps with up to six parameters are available
- Use custom expressions to display statistics and calculations
 |
 |
|
| Color encoded value in multiparameter heatmap |
Single parameter heatmap displaying value |
