Using Advanced Plot Types in Kaluza: Comparison Plots for Visualization of the TCR V Beta Repertoire
This application note introduces the Comparison Plot as a tool to compare several data sets in line or bar charts. You will see how Comparison Plots can be used to visualize a clonogram representation of the TCR Vβ repertoire and learn how to create a new Comparison Plot using Kaluza Analysis Software*.
Comparing Flow Cytometry Data Across Samples
Meaningful insights are often generated by comparing results from different samples, for example from different time points or cell culture conditions. Histogram and dot plot overlays can help with the visualization of this kind of data (Figure 1) and are available in most flow cytometry software packages.

Figure 1. T Cell Cytokine Expression Comparison. Comparison of unstimulated (control, blue) and stimulated (red) CD4+ T cells. A normal whole blood sample was activated using DURActiv 1 * (Part Number C11101) and stained with DURAClone IF T Helper Cell Tube * (Part Number C04666) per manufacturer’s instructions. A and B show histogram overlays of IFN gamma and IL-4 expression, respectively. Figure C shows dot plot overlays for both cytokines. Plots are for illustration purposes only.
However, in order to perform advanced statistical analysis and comparisons of cell frequency and marker abundance, the export of statistical results and data analysis in spreadsheet programs or statistical software is often required. The Comparison Plot allows the user to compare a given statistic across data sets and populations, thus streamlining the workflow by allowing the visualization of line and bar charts directly in the software used for the analysis of flow cytometric data (Figure 2).

Figure 2. Comparison Plot Bar Chart Visualization of IL-4 and IFN Gamma Expressing CD4+ T cells in a Control and Stimulation Sample. A normal whole blood sample was activated using DURActiv 1 * (Part Number C11101) and stained with DURAClone IF T Helper Cell Tube * (Part Number C04666) per manufacturer’s instructions. Plots are for illustration purposes only.
Flow Cytometric Determination of the T cell TCR Vbeta Repertoire
The analysis of TCR repertoire is of high value to better understand the immune system. Flow cytometry quickly measures the proportional TCR-Vβ usage in multiple T cell subsets on a per-cell basis, without the need for cell-sorting 1. The IOTest Beta Mark TCR Vβ Repertoire Kit (IM3497) allows the assessment of 24 different TCR Vβ representing about 70% coverage of normal human TCR Vβ repertoire. It provides a snapshot of the diversity of the repertoire, percentage of each TCR Vβ among overall T cells or a specific subsets, and visibility on potential expansion of a specific clone.
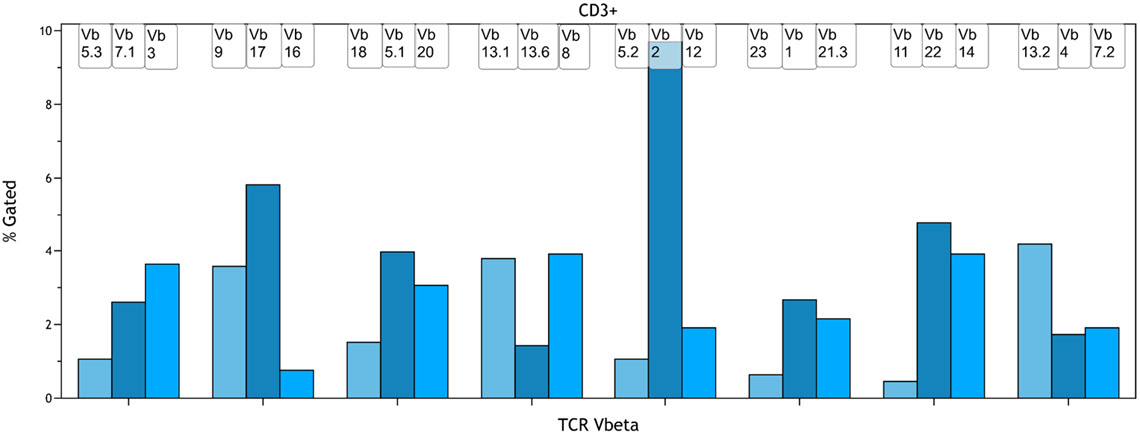
Taking advantage of the fact that Vβ specificities may be grouped into mutually exclusive combinations, the detection of 3 Vβ expressions in the same tube is possible with the use of an innovative staining strategy combining three monoclonal antibodies with only two fluorophores. Historically, the percentage of T cells expressing a given TCR Vβ chain was determined using flow cytometry analysis software and transferred to a spreadsheet program to visualize the distribution as a so called clonogram. Using the Kaluza Comparison Plot, a comparable visualization can be achieved without the need for data export to a second software package (Figure 3).

Figure 3. Clonogram Representation of the TCR Vβ Repertoire in CD3+ T-cells. A normal whole blood sample was stained with IOTest Beta Mark TCR Vβ Repertoire Kit * (Part Number IM3497) per manufacturer’s instructions. Plots are for illustration purposes only.
Creating a TCR Vβ clonogram using the Comparison Plot
- Stain a sample using the Beta Mark TCR Vβ Repertoire Kit in 8 tubes and acquire data on a flow cytometer. For detailed protocol and methodology, please refer to the kit instruction for use available at beckman.com/techdocs.
- Load the resulting 8 data files in Kaluza and create a gating strategy to identify the T cell subset you want to analyse. An exemplary gating strategy for CD3+ T cells is provided in Figure 4. For detailed instructions on how to create plots and gates in Kaluza, refer to the Kaluza IFU (Part Number C10986).
- Copy the protocol with the newly created gating strategy onto the remaining 7 files by drag and drop or using copy + paste special. This ensures that all gates and quadrants will have the same names across all data sets, a critical aspect for downstream visualization.
- Create a Composite of all 8 files. You may wish to cut and past the generated plots for all samples on a single plot sheet to make it easier to navigate.
- Optional: link gates used to identify T cell subsets. This will apply changes made to the gate for one data set to all other data sets. To link gates position your mouse over the gate, right click, and access Radial Menu and navigate to the Data menu. Select the Link to Gates hyperlink. A pop-up window appears with a list of gates applicable for linking. Select the gate(s) that you wish to link to the current gate.
- Create a new Comparison Plot and switch y-axis to % gated. Add quadrants that are used to identify Vβ chain expressing cells as series by selecting <Add a series> and sequentially selecting the quadrant names from the Input Gate drop down menu.

Figure 5: Comparison Plot Setup. The density plot on the left shows quadrants used for identify Vβ chain expressing cells. The Comparison Plot contains 3 data series. Quadrant A++ and A-+ have already been assigned appropriately. A normal whole blood sample was stained with IOTest Beta Mark TCR Vβ Repertoire Kit * (Part Number IM3497) per manufacturer’s instructions. Plots are for illustration purposes only.
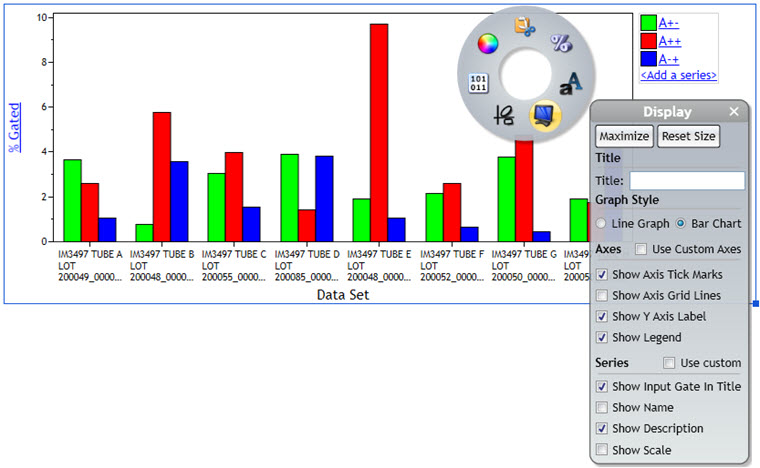
- Switch the Comparison Plot to Bar chart by right clicking the Comparison Plot and selecting the Display option on the Radial menu.

Figure 6. Comparison Plot Display Settings. A normal whole blood sample was stained with IOTest Beta Mark TCR Vβ Repertoire Kit * (Part Number IM3497) per manufacturer’s instructions. Plots are for illustration purposes only.
- Change labels and colors: to achieve a result comparable to Figure 2, make the following adjustments:
- Change the color of the bars by accessing the Coloring sub-menu. Coloring is assigned for the first, second and third bar and will be identical across all datasets.
- Access the Display menu to remove the plot legend.
- Access the Display menu and indicate the population the Vβ chains were gated on as Title.
- Access the Display menu and select the “Use custom axis” option. You may enter TCR Vbeta as X axis title.
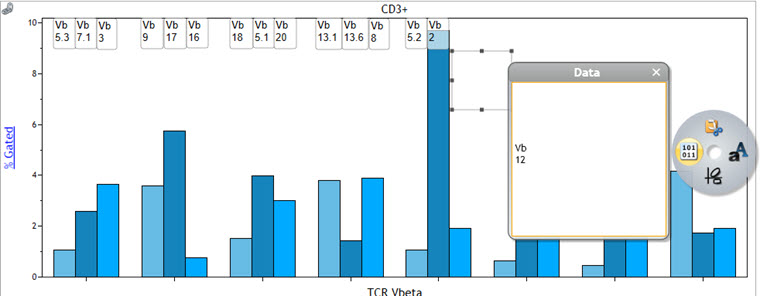
- To label the bars with the corresponding TCR Vβ chains access the radial menu and select the Gates & Tools menu. Select Annotation. Click and drag your mouse over the plot to create a text box. Release the mouse button when the box is the size you prefer. Right click on the text box and access the Data sub-menu of the Radial Menu. Click within the data field and type the annotation text, in this case the TCR Vβ chains detected in a specific quadrant. Move the text box above the bar corresponding to the quadrant. Repeat for all bars.

Figure 4. Example of Data from Tube A. White blood cells are gated using the side and forward scatters and T cells using CD3. The three TCR Vβ of each tube are displayed in a dot plot, with the TCR Vβ conjugated to both FITC and PE appearing in the diagonal of the double positive quadrant. A normal whole blood sample was stained with IOTest Beta Mark TCR Vβ Repertoire Kit * (Part Number IM3497) per manufacturer’s instructions. Plots are for illustration purposes only.

Figure 7. Adding Bar Labels Using the Annotation Function. A normal whole blood sample was stained with IOTest Beta Mark TCR Vβ Repertoire Kit * (Part Number IM3497) per manufacturer’s instructions. Plots are for illustration purposes only.
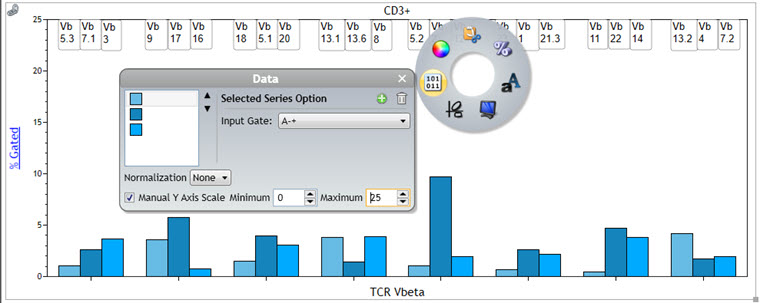
If you wish to control the Y Axis scale, access the Radial menu and select Data. Check the box for Manual Y Axis scale and enter the desired Minimum and Maximum.

Figure 8. Manual Y Scale Adjustment on Comparison Plot. A normal whole blood sample was stained with IOTest Beta Mark TCR Vβ Repertoire Kit * (Part Number IM3497) per manufacturer’s instructions. Plots are for illustration purposes only.
Summary
The Kaluza Comparison Plot supports the visualization of differences in population abundance between datasets and input populations. Accessibility to line and bar graphs in a flow cytometry data analysis package helps streamline workflows and makes data export and transfer into other software packages unnecessary.
References
- van der Geest KSM, Abdulahad WH, Horst G, et al. Quantifying Distribution of Flow Cytometric TCR-Vβ Usage with Economic Statistics. Turner SJ, ed. PLoS ONE. 2015;10(4):e0125373. doi:10.1371/journal.pone.0125373
* For Research Use Only. Not for use in diagnostic procedures.

