Why Use Machine Learning-assisted Analysis?
Due to the advancement of technology in the cytometry field, we are now able to measure many parameters simultaneously on a single cell level. The dimensionality of datasets has increased from traditional 4-5 color low parameter to 10-20 or more colors with several commercially available instruments. The sample size per experiment is also getting increasingly larger in terms of the number of events and number of samples collected. This imposes a challenge to data management, collaboration, and data visualization and analysis. Many machine learning algorithmic tools are developed for dimensionality reduction and clustering to handle this increase in data complexity.

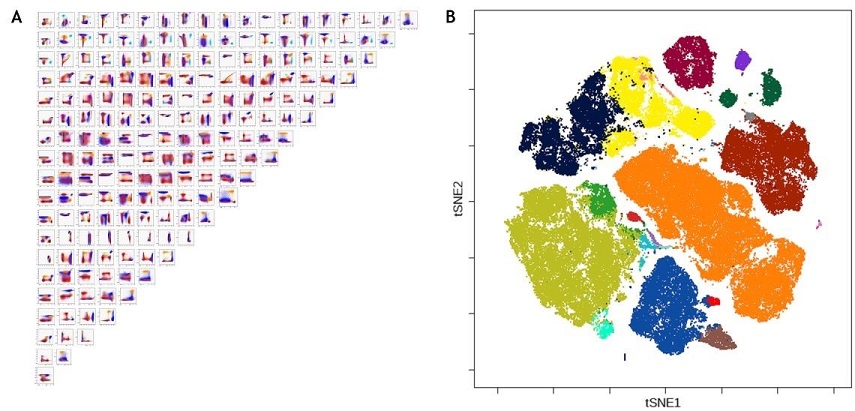
Figure 1. Comparison of Biaxial Plots and Machine Learning Analysis of Flow Cytometry Data. N by N plot view of a 20-color panel cytometry data resulting in 190 plots, panel A. viSNE (or t-SNE) map view of the same data that visualize the 24-parameter information on one single map, panel B.
Subjectivity in Hierarchical Gating
In manual data analysis based on placement of gates to subgroup populations of cells, it is well established that the subjectivity in gate placement is a contributor to variability in flow cytometry studies 1. For large studies, some groups have attempted to address this with centralized manual gating, creating specialized roles in the study teams 2. This approach is difficult to scale, creating bottlenecks in the analysis. Methods that reduce human subjectivity in analysis are seen to be the next wave of innovation in the field of flow cytometry.
Data Analysis and Interpretation Challenges
In a survey of flow cytometrists exploring themes in multicolor flow cytometry, over half of the respondents cited challenges in both data analysis and interpretation. Most scientists using flow cytometry in their research approach are using the analysis software readily available, much of which has not been developed to meet the increasing demands of multicolor flow cytometry data sets.
In A chromatic explosion: the development and future of multiparameter flow cytometry the authors describe that the least developed flow cytometry technology has been data analysis.3 And this is where the most potential and greatest need exists to continue to advance the field.

Figure 2. Multicolor Flow Cytometry Survey. In a user survey conducted in December 2019, 581 flow cytometry researchers answered topics related to data analysis. Panel A shows the proportion of respondents who indicated data analysis or interpretation of results were challenges in their multicolor flow cytometry experiments. Panel B indicates the experience level with machine learning assisted analysis, 49% of respondents are using or planning to use ML-assisted analysis in their multicolor flow cytometry experiments.
The Cytobank platform provides an approachable and comprehensive data analysis workflow. Analyses are conducted in the cloud using any web-enabled device and includes the use of built-in algorithms, no coding or R scripting required. A Learning Center with videos and step-by-step instructions help users get started on the platform, and an online knowledge repository includes articles, tips-and-tricks as well as a support request form for responding to questions.
Resources for Data Analysis
Video Overview of Cytobank Platform
References
- Maecker HT, Rinfret A, D'Souza P, Darden J, Roig E, Landry C, et al. Standardization of cytokine flow cytometry assays. BMC Immunol 2005 Jun 24;6:13.
- Finak, Greg et al. “Standardizing Flow Cytometry Immunophenotyping Analysis from the Human ImmunoPhenotyping Consortium.” Scientific reports vol. 6 20686. 10 Feb. 2016, doi:10.1038/srep20686
- Chattopadhyay PK, Hogerkorp CM, Roederer M. A chromatic explosion: the development and future of multiparameter flow cytometry. Immunology. 2008;125(4):441–449. doi:10.1111/j.1365-2567.2008.02989.x

